


Key Takeaways
Sales outgrew clicks across the weekend
Across more than 8,800 retailers, sales ran at 3.7x an average October day on only 2x the clicks, and cost per sale was 7% lower.
Toys and electronics peaked hardest
Toys & Games sales ran at 8x an October day, and Electronics at 7x, with Friday at 10.3x and 9.9x.
Sales rose faster than click prices
Cost per click was 1.16x to 2.19x October, yet Food & Drink cost per sale fell 41% and Clothing & Accessories 21%.
Every sector peaks differently
Friday was the biggest day in seven of the eight sectors, but Food & Drink was flat all weekend and Toys & Games kept a strong Sunday.
In short: Over Black Friday weekend 2025 (Friday 28 November to Monday 1 December), retailers advertising through Redbrain on Google and Bing Shopping saw sales per day at 3.7x an average October day, on only 2x the clicks. Click prices rose, but sales rose faster, so cost per sale ended 7% lower. How big the weekend was depended heavily on the sector, from 8x in Toys & Games to 1.3x in Pets. Below are the overall benchmark and the benchmarks for eight sectors, so you can compare your weekend with your sector’s, not with the average.
How did Black Friday weekend perform across all sectors?
Redbrain runs Google and Bing Shopping for thousands of retailers in the UK and Europe. For this analysis we looked at more than 8,800 retailers over Black Friday weekend 2025 and compared their average day with their average day in October 2025. Every figure is a multiple of that October day, so “3.7x” means a day with 3.7 times the October level.
Black Friday 2026 is Friday 27 November and Cyber Monday is Monday 30 November, so last year’s weekend lines up day for day. For the wider peak calendar, see our key dates for Black Friday and Cyber Monday 2026.
Across all sectors, the weekend looked like this:
- Sales: 3.7x an October day, with order value at 3.6x.
- Clicks: 2x, so the weekend was won on conversion, which was 1.85x higher.
- Click cost: 1.72x October.
- Cost per sale: 7% below October, because sales grew faster than click prices.
- By day: Friday 4.6x, Saturday 3.3x, Sunday 3.7x and Cyber Monday 3.1x.
What did each sector’s weekend look like?
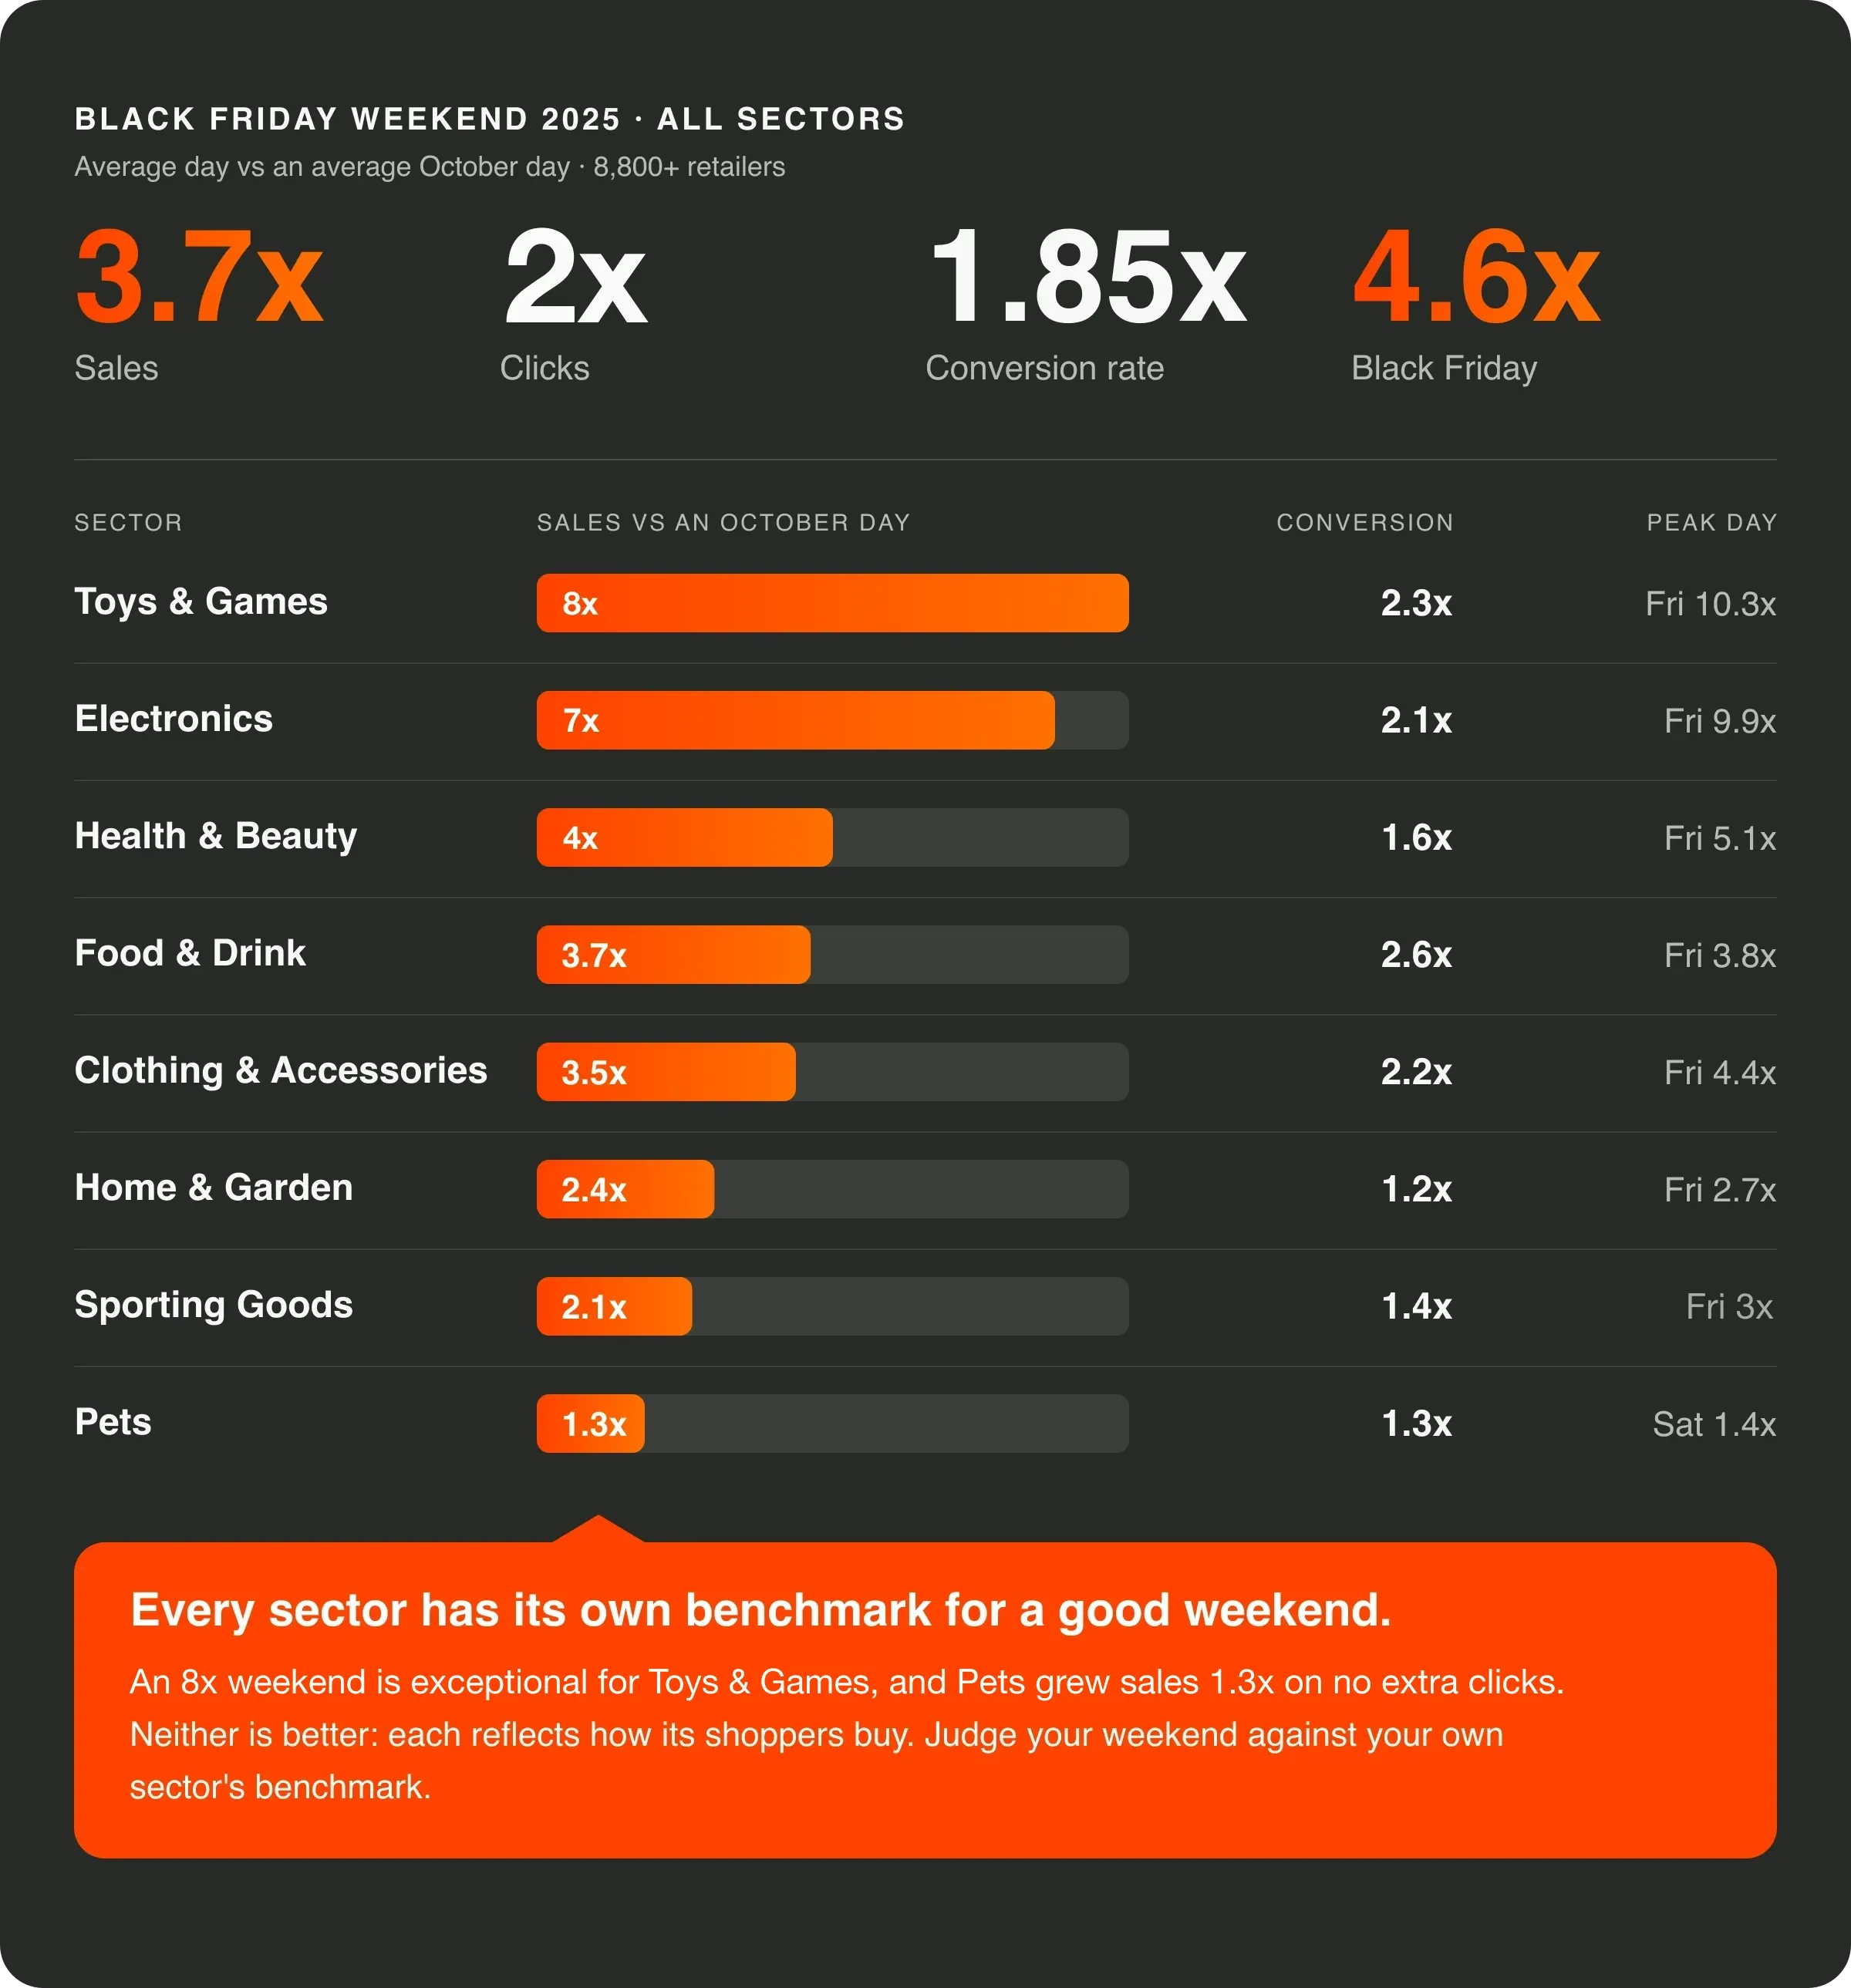
Every sector has its own benchmark for a good weekend. An 8x weekend is exceptional for Toys & Games, and Pets grew sales 1.3x on no extra clicks. Neither is better, because each reflects how its shoppers buy. Every sector converted better than in October, and in every sector sales grew faster than clicks, so the weekend was won on conversion, not on traffic alone. The sector sections below give the click costs and cost per sale.
Which sectors had the biggest Black Friday weekend?
Toys & Games and Electronics, by a distance. Their sales per day were 7x to 8x an October day, against 3x to 4x for most others. Here is each sector.
Toys & Games
- Sales averaged 8x an October day across the weekend, driven by a conversion rate 2.3x higher on only 3.4x the clicks.
- Black Friday was 10.3x October, but Toys & Games kept more of its momentum than any other sector: Sunday still reached 8.6x.
- Cost per sale ended 17% below October even though click cost was 1.91x.
Gift shoppers buy fast once a price looks right.
Electronics
- Sales ran at 7x October on only 3.4x the clicks, with Friday at 9.9x.
- Electronics also faded fastest, with Monday at 4.9x against Friday’s 9.9x.
- Order value per sale was 9% lower than in October as shoppers bought cheaper deals.
Health & Beauty
- Sales were 4x October, with 2.6x the clicks, and cost per sale fell 9%.
- The average order rose to 1.14x October, as shoppers stocked up on gift sets.
- Friday led at 5.1x, Sunday followed at 4.3x, and Cyber Monday fell back to 2.9x.
Food & Drink
The most efficient sector of the weekend. Sales were 3.7x October on only 1.4x the clicks, so cost per sale fell by 41%, the biggest drop of any sector. Demand was also the flattest: 3.8x on Friday, 3.5x on Saturday, 3.8x on Sunday and 3.5x on Monday.
Clothing & Accessories
- Sales were 3.5x October on 1.6x the clicks, and cost per sale fell 21%.
- Clothing had the largest retailer base of any sector, and its weekend was Friday-led: 4.4x on Friday, then 3.1x to 3.4x for the other three days.
- The average order was 26% lower than in October, which points to shoppers buying more cheaper items on discount.
Home & Garden
- A steadier lift: sales were 2.4x October on 2x the clicks.
- Home & Garden had one of the biggest rises in average order, up to 1.32x October, so each sale was worth more.
- Friday was 2.7x, with the other days between 2.1x and 2.5x.
Sporting Goods
- Sales were 2.1x October, and this sector had the smallest rise in click cost, at 1.16x October.
- The spike was Friday-only: 3x, then 1.7x to 1.9x on the other three days.
- Cost per sale fell 14%.
Pets
A steady weekend: sales were 1.3x October on no extra clicks, and the four days were almost identical (1.3x to 1.4x). Click cost was 1.22x and cost per sale 9% lower. Pet owners buy on a routine, and a discount weekend barely changes it.
Which day of the weekend mattered most?
Friday was the peak in every sector except Pets, but the shape of the weekend after Friday varied a lot. Toys & Games, Health & Beauty and Electronics had a clear Sunday recovery, while Sporting Goods and Clothing dropped away after Friday and stayed level. Cyber Monday was the weakest day of the four in Electronics, Health & Beauty and Toys & Games.
What does a CSS partner add on a peak weekend?
Every Shopping ad runs through a Comparison Shopping Service (CSS). Retailers can use Google Shopping’s own CSS or add a Premium CSS Partner such as Redbrain, working within Google’s CSS programme. In the UK, the EEA and Switzerland, ads placed through a CSS partner can come with a lower cost per click, plus extra reporting, optimisation and support. You can read the detail in our guide to choosing a CSS partner.
That matters most on this weekend. Average click prices were 1.72x October, and in Electronics 2.19x. A lower cost per click lets the same budget buy more of the clicks that convert at peak, and daily budget control, feed readiness and live tracking decide how well the weekend is used.
Black Friday weekend 2025 in numbers
How Redbrain can help
Redbrain is a Google Premium CSS Partner, Google CSS Spotlight winner in 2024, 2025 and 2026, and Gold winner for Best Paid Search Campaign at the 2026 Performance Marketing Awards. We plan Black Friday weekend with retailers every year, and we can show how your categories compare with these benchmarks before 27 November.
- Sector benchmarks for your own sales, conversion rate and cost per sale.
- A day-by-day budget plan shaped to how your sector peaks, not the average.
- Feed and price readiness so your sale prices are live before the weekend starts.
- Live tracking through the weekend in Redbrain Connect.
See what retailers have achieved with a Redbrain CSS:
- eBay: sales value up 62% in the UK and 84% in Germany.
- B&Q: conversion rate up 21%, using seasonality to capture peak demand.
- Boden: click-to-sale growth of 133%.
Read about our Gold award for Best Paid Search Campaign and our Google CSS Spotlight award.
Actionable recommendations
-
#1
Benchmark against your sector, not the average
Every sector has its own benchmark for a good weekend, from 1.3x sales in Pets to 8x in Toys & Games. Use the graphic above to compare your weekend with your own sector's benchmark.
-
#2
Match the day-by-day budget to your sector's shape
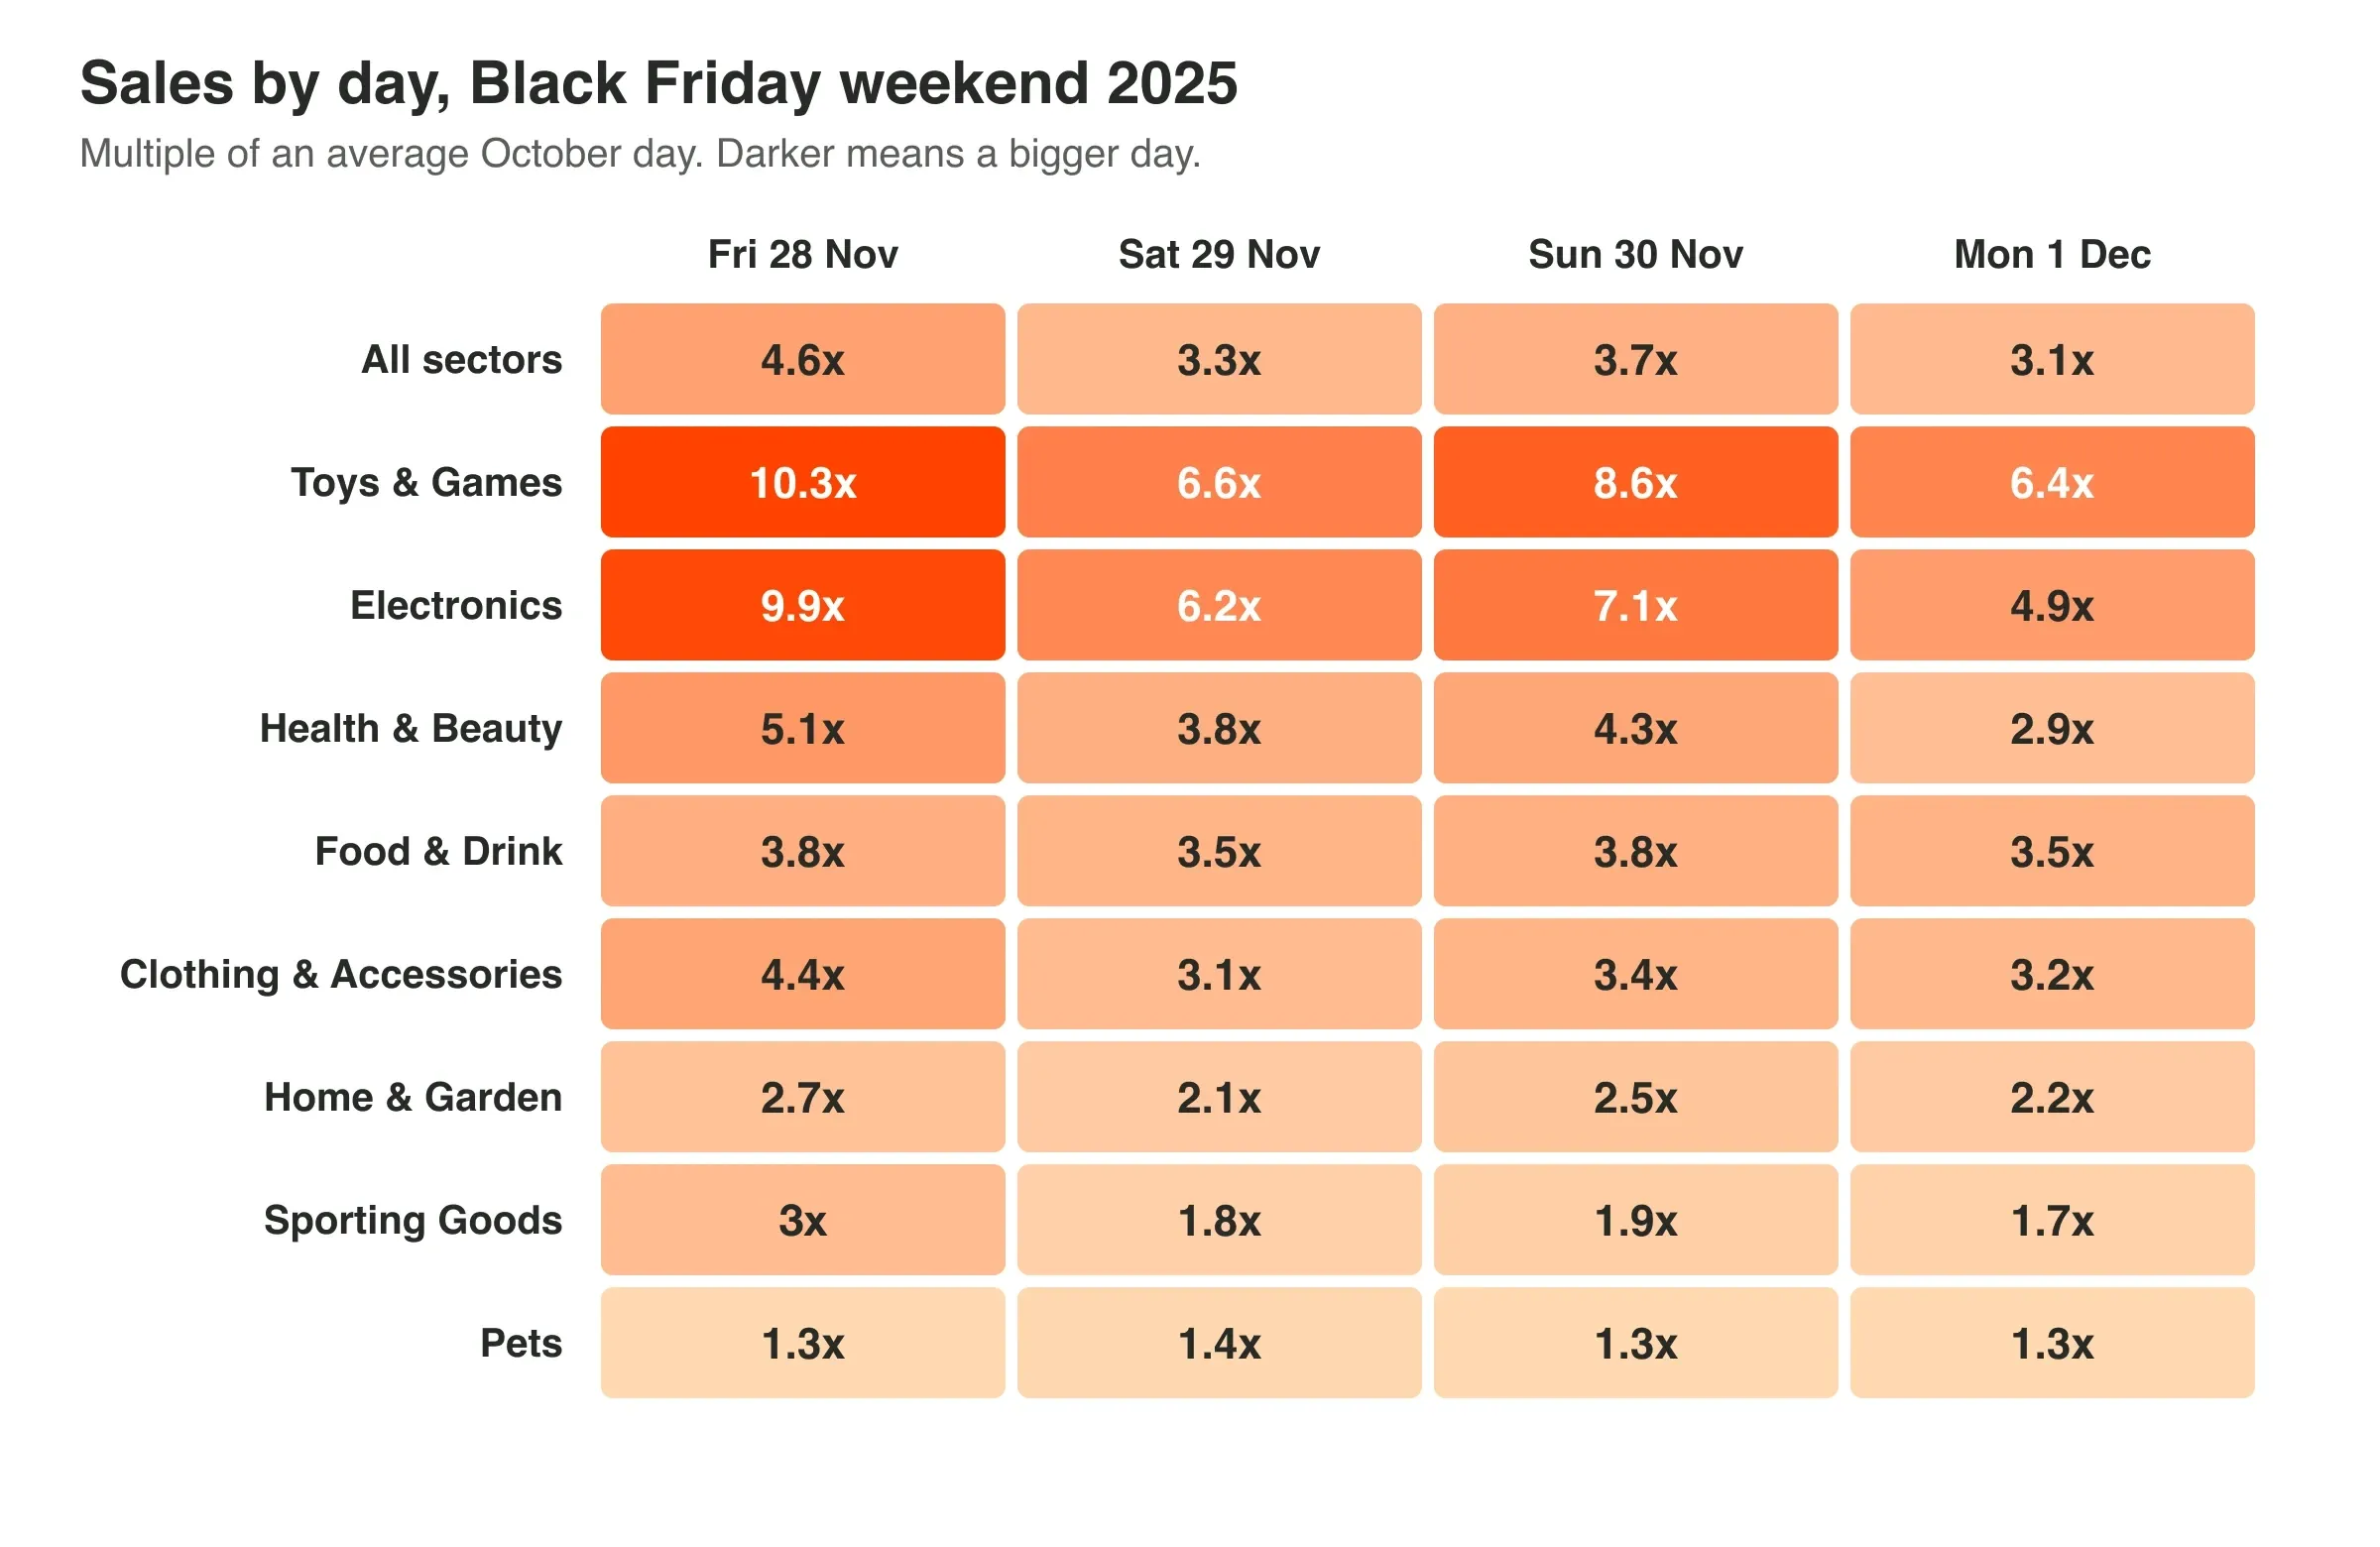
The day-by-day heatmap shows when your sector peaked. Some sectors were Friday-led and others held up all weekend, so one budget shape does not fit every category.
-
#3
Plan for the click cost increase
Click cost rose in every sector, to between 1.16x and 2.19x October. Set a cost-per-sale target for the weekend instead of capping clicks.
-
#4
Lift order value where you can
The average order rose in Health & Beauty and Home & Garden. Check which of your lines can lift order value over the weekend.
-
#5
Get prices and feeds live early
Feed changes can take up to 48 hours to appear, so have sale prices live before the weekend starts.
Methodology
This analysis uses aggregated, anonymised Google and Bing Shopping data from campaigns run by Redbrain for retailers in the UK and Europe. It compares the average day over Black Friday weekend 2025 (Friday 28 November to Monday 1 December) with the average day in October 2025. The overall figures cover more than 8,800 retailers, and no single retailer contributed more than 3% of weekend order value. Sector comes from the retail category each retailer is classified under. Eight sectors are shown, covering more than 5,500 retailers; other sectors are not shown, and categories dominated by one or two retailers are always left out. Marketplaces are excluded. Rises are shown as multiples of October and falls as percentages below it. Cost figures are never shown as amounts. Sales are orders, and conversion rate is orders per click. No individual retailer’s data is shown.
Frequently asked questions
Which industry sells the most over Black Friday weekend?
In 2025, Toys & Games had the largest weekend lift on Google and Bing Shopping, with sales per day at 8x an average October day, followed by Electronics at 7x. Black Friday itself reached 10.3x in Toys & Games.
Which day of Black Friday weekend is best for Shopping ads?
Black Friday itself was the biggest sales day in seven of eight sectors in 2025, and 4.6x an October day overall. Sunday was the second-best day in most, and Cyber Monday was the weakest of the four days in Electronics, Health & Beauty and Toys & Games.
How much more do clicks cost over Black Friday weekend?
In 2025, cost per click over the weekend was 1.72x an average October day overall, and between 1.16x and 2.19x depending on the sector. Sales grew faster than costs in most sectors, so overall cost per sale was 7% lower than in October.